
Lihat juga


 10.09.2026 05:06 AM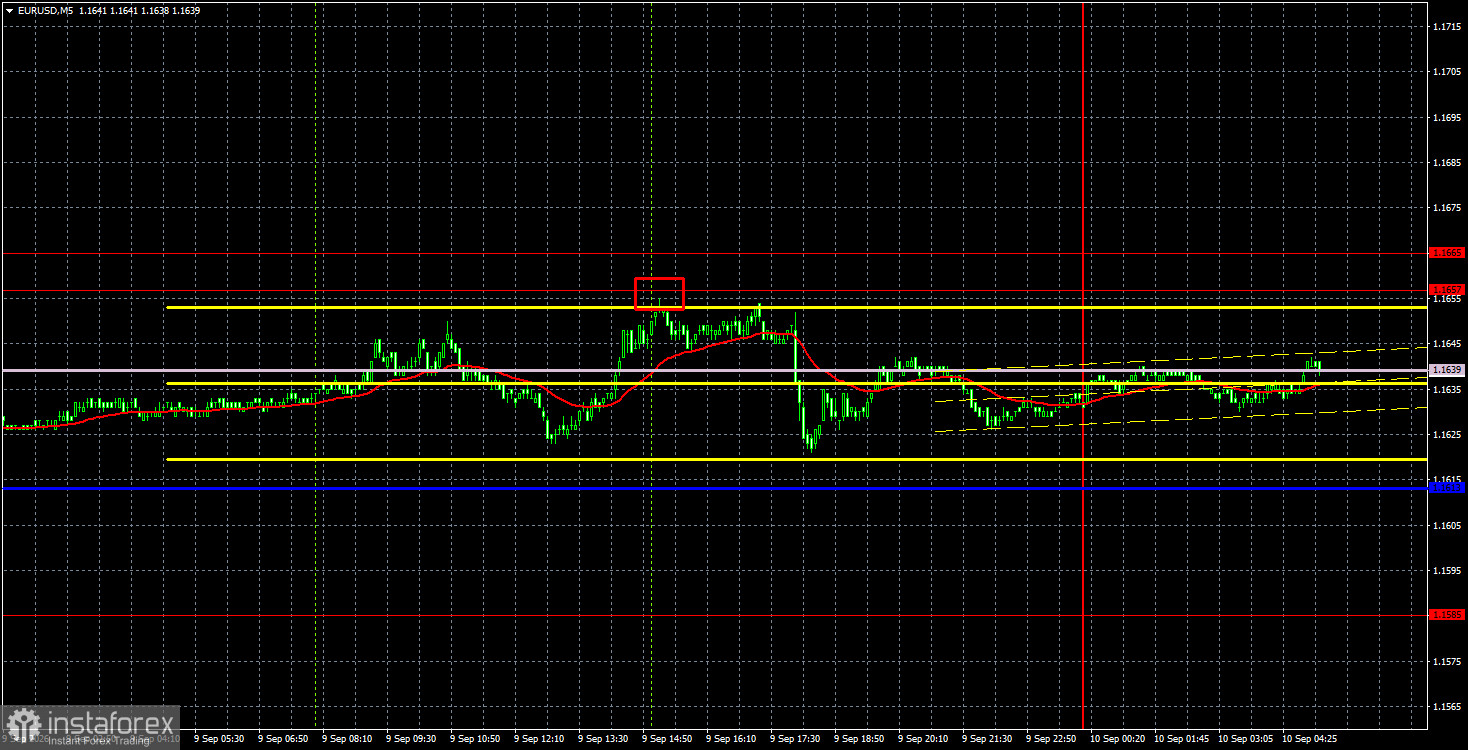
The EUR/USD currency pair again showed minimal volatility on Wednesday and maintained a modest upward, clearly corrective bias. A new trendline points to continued upward movement. Price has also moved above Ichimoku lines, indicating further upside. However, the weakness of the euro's advance suggests the move may be corrective — so a decline could resume at any time. On what grounds? That is the key question. From our perspective, the dollar still has no medium-term reasons to rise. Locally, the dollar can strengthen on specific events or reports or as part of a correction, but we cannot expect the pair to fall to, say, 1.1300. Therefore, despite the corrective nature of the current rise, we still expect the euro to strengthen in the medium term. Today the European Central Bank will announce its decision, and the rate hike is already priced in. Christine Lagarde is unlikely to give forward guidance, so her remarks may be bland. The euro may tick a bit higher today, but we do not expect super-high volatility.
Technically, the pair is forming a new upward trend that still looks corrective. Events this week can either break the trend or turn it into a full-blown trend. The ECB decision today may support the euro; tomorrow's US inflation report may create fresh problems for the dollar.
On the 5-minute TF on Wednesday, one sell signal formed. Early in the US session, price bounced from the 1.1657–1.1665 area with minimal deviation, allowing short entries. Movements were weak, so intraday profit potential was limited to about 10–15 pips.
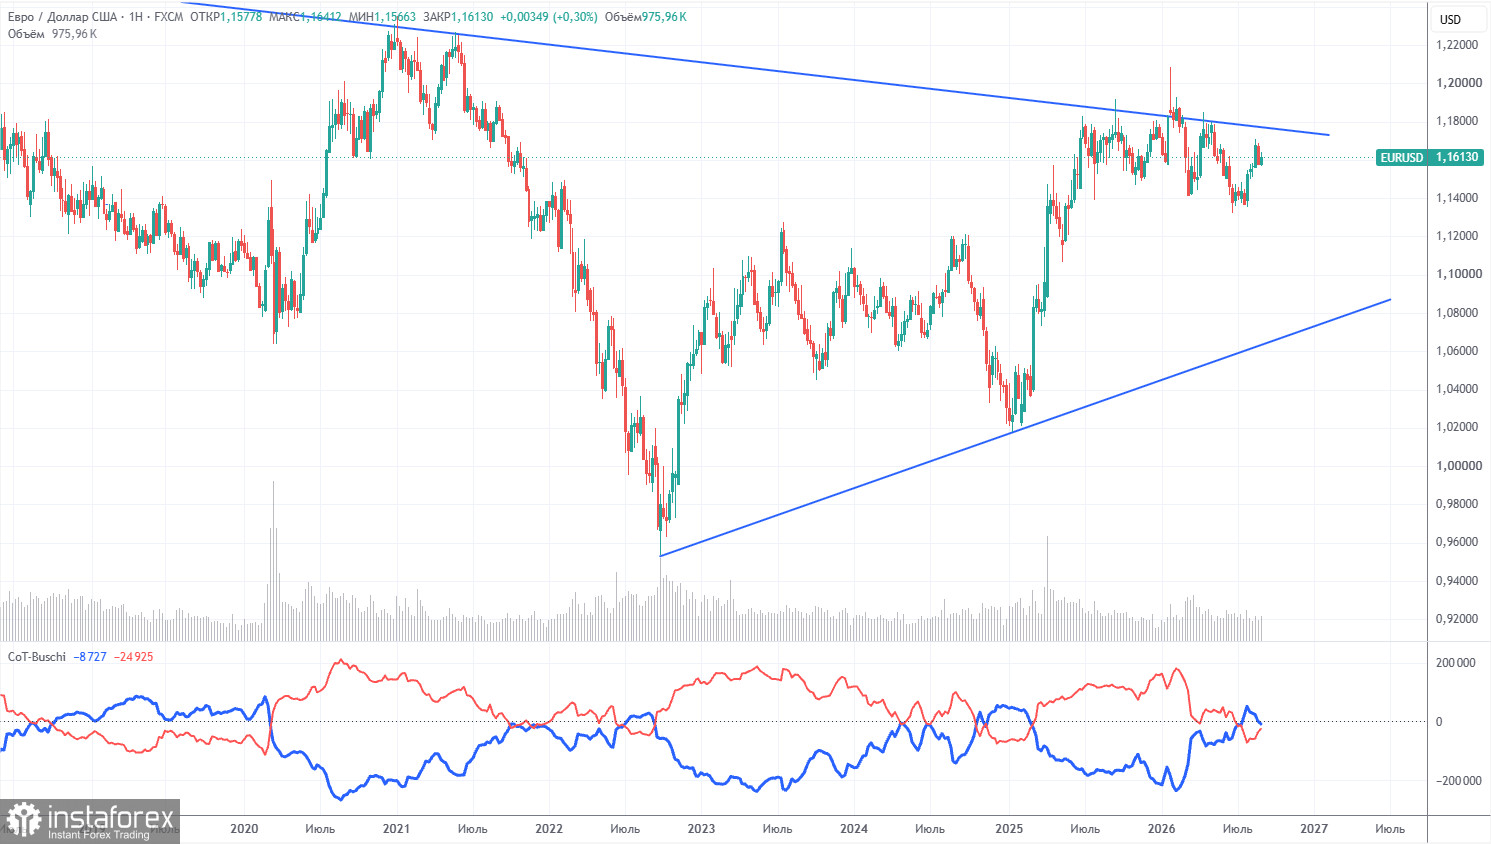
The latest COT report is dated September 1. On the weekly timeframe, non-commercial traders' net position turned bearish and declined markedly in 2026 due to geopolitical events. Over the past six months, traders have reduced euro exposure in favor of the US dollar. Trump's policy has not changed, and the dollar served for a time as the "reserve currency."
However, we still do not see any fundamental reasons for further dollar strengthening. The Middle East war made the dollar temporarily very attractive, but that factor's shelf life may already be expiring. In the long term, the euro could fall to 1.08 (trendline), but the uptrend remains valid. After recent months of dollar strength, the pair has not approached that trendline much.
The red and blue COT lines indicate approximate parity between bulls and bears. During the last reporting week, Non-commercial longs rose by 4,500 while shorts fell by 6,900, so the net position increased by 11,400 contracts.
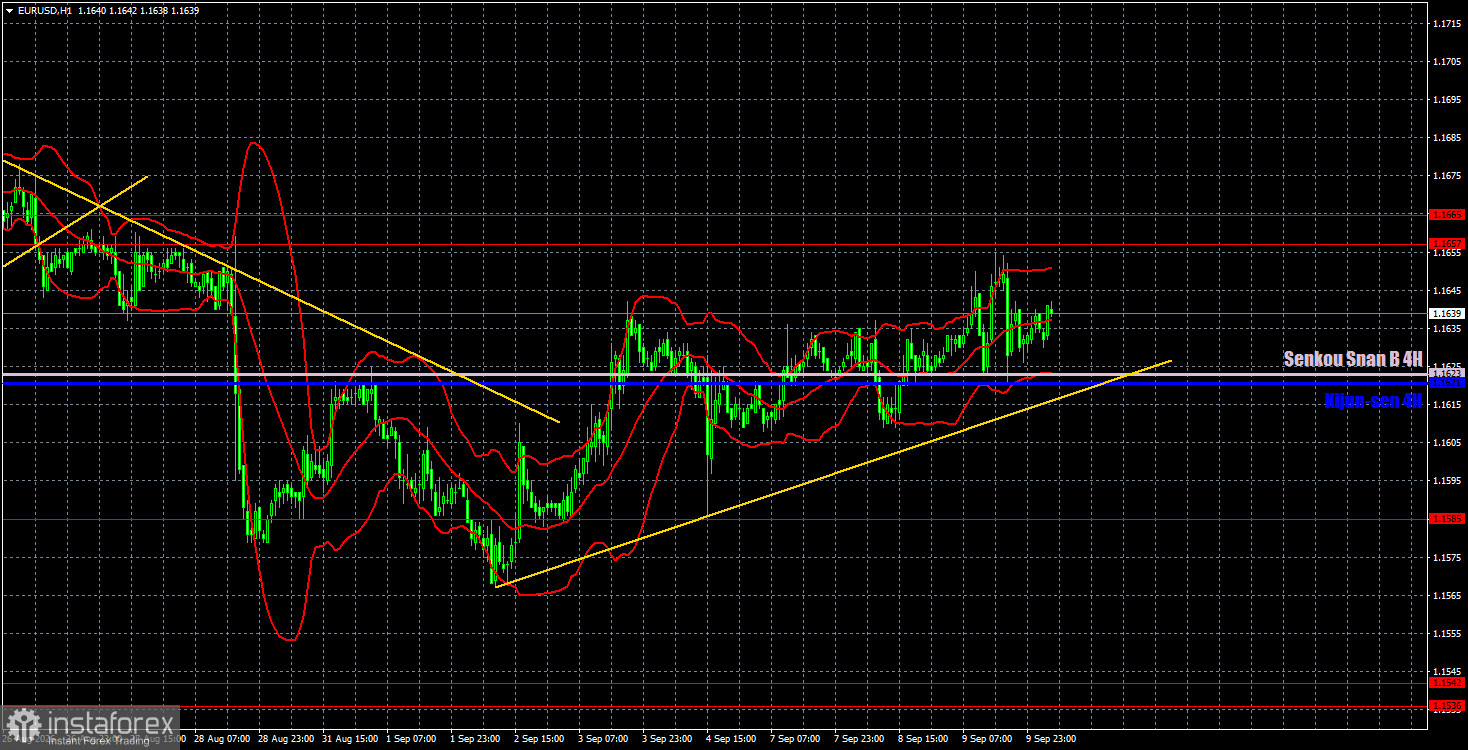
On the hourly timeframe, EUR/USD continues the new upward trend. The situation in the Middle East remains tense but is not enough for a renewed strong-dollar rally. The euro's rise has been very muted because the market has traded sluggishly in recent weeks. However, today, tomorrow, and next week, we can expect rising volatility and, accordingly, trend moves — the market will receive the information it needs to trade.
Key trading levels for September 10 — 1.1234, 1.1274, 1.1362–1.1368, 1.1461–1.1473, 1.1536–1.1542, 1.1585, 1.1657–1.1665, 1.1750–1.1760, 1.1786, 1.1830–1.1837 — and Ichimoku lines Senkou Span B (1.1623) and Kijun-sen (1.1621). Ichimoku lines may shift intraday; account for that when taking signals. Move Stop Loss to breakeven after price moves 15 pips in the favorable direction to protect against false signals.
Today, the ECB decision and Christine Lagarde's press conference are the focus in the eurozone; in the US, only secondary releases are scheduled, including PPI. All attention is on the ECB.
Today, traders can consider short positions with targets of 1.1621 and 1.1623 if price bounces from the 1.1657-1.1665 area. Consolidation above the area of 1.1657-1.1665 will allow opening long positions with a target of 1.1750-1.1760. Volatility may rise slightly today, but it is unlikely to be high.
Support and resistance price levels are thick red lines where movement may conclude. They are not sources of trading signals.
The Kijun-sen and Senkou Span B lines are Ichimoku indicator lines transferred to the hourly timeframe from the 4-hour timeframe. They are strong lines.
Extreme levels are thin red lines from which the price has previously rebounded. They are sources of trading signals.
Yellow lines indicate trend lines, trending channels, and any other technical patterns.
Indicator 1 on COT charts shows the size of the net position of each category of traders.


