
Veja também


 14.09.2026 04:45 AM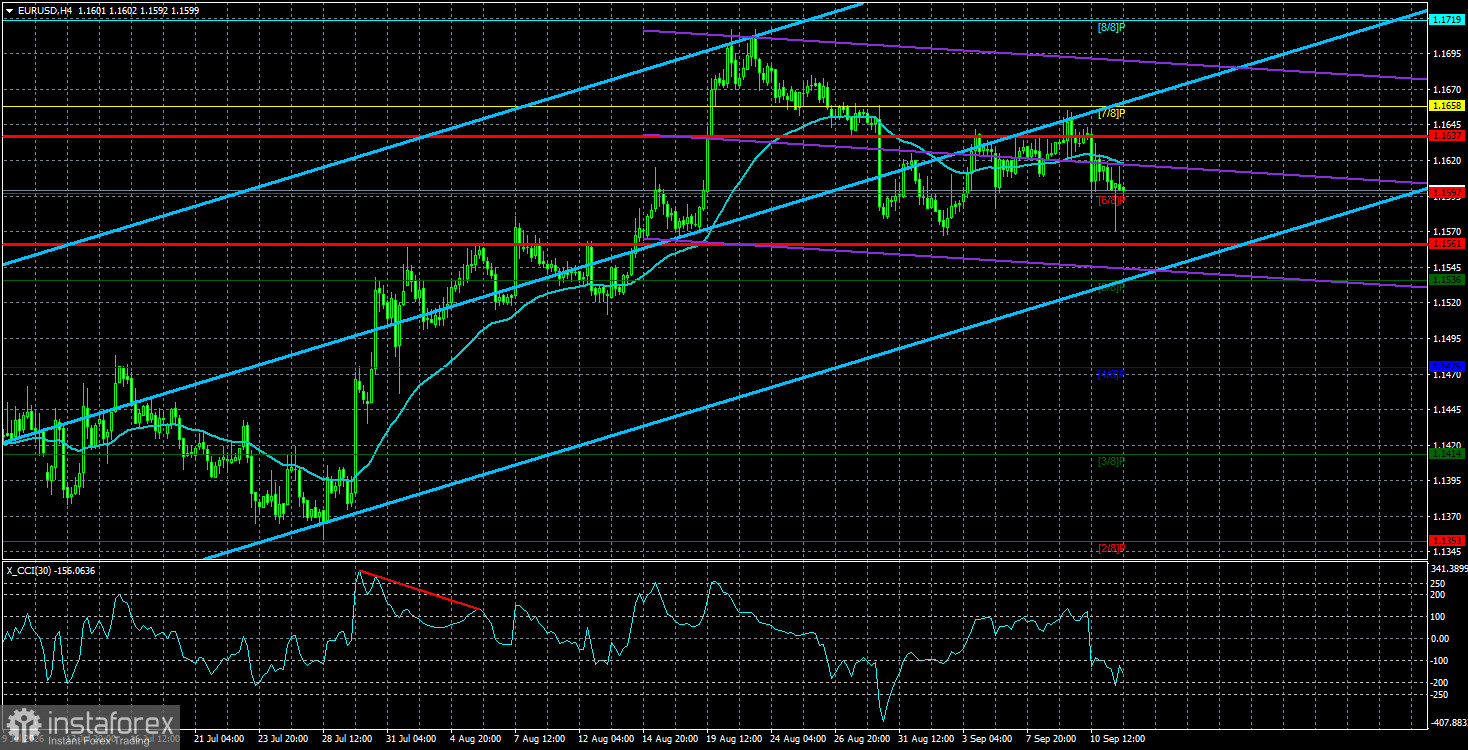
The EUR/USD currency pair again traded with minimal volatility and a complete lack of conviction on Friday. We again draw traders' attention to the fact that over the past one and a half months, volatility exceeded 63 pips only twice and 58 pips only four times. In other words, over the last thirty days the pair moved less than 59 pips in a day on 26 occasions, and the average volatility over this period is 44 pips per day. That is all you need to know right now about the market's willingness to trade.
Last week, several interesting and important events should have provoked an increased market reaction. In principle, that is what happened. On Thursday, the European Central Bank announced a rate increase for the second time in 2026 and left the door open for further monetary tightening. On Friday, the US inflation report was released, which became the final chord of the sonata called "Preparation for the Fed meeting." Although traders understood what to expect in both cases and their expectations were fully met, we do not consider the reaction logical or adequate. On Thursday the pair moved 49 pips, on Friday — 50. Under current circumstances, such figures do represent a rise in volatility, because in the first three days of the week it did not exceed 34 pips.
We do not know whether it is worth analyzing the ECB meeting or the inflation report in detail right now, let alone other data, events, and news. We have said many times in our articles that if the market does not want to move and traders do not want to trade, no fundamental or macroeconomic events or technical signals will make the price move more actively. So the ECB could have raised rates by 3%, and US inflation accelerated to 10% — if the market sees no reason to react, there will be no movement.
Recall that the ECB has tightened policy for the second time this year, and this time is unlikely to be the last. Oil is rising again rapidly, so inflation will accelerate globally. The question now is only how central banks will respond. The ECB has shown it is ready to pursue a hawkish policy. The Bank of England is also prepared to tighten as long as needed. The remaining question is the Federal Reserve. At the moment, the market is 87% certain that the Fed will raise the key rate on Wednesday. If so, that decision is already priced in, and we should not expect a strong rise in the US currency. At the same time, we get the impression that the market is deliberately looking for any pretext to buy the dollar, which we have seen more than once in 2026. We are more concerned that the market again ignores factors pointing to euro strength — the ECB's tightening being one of them. And this is far from the first time in 2026.
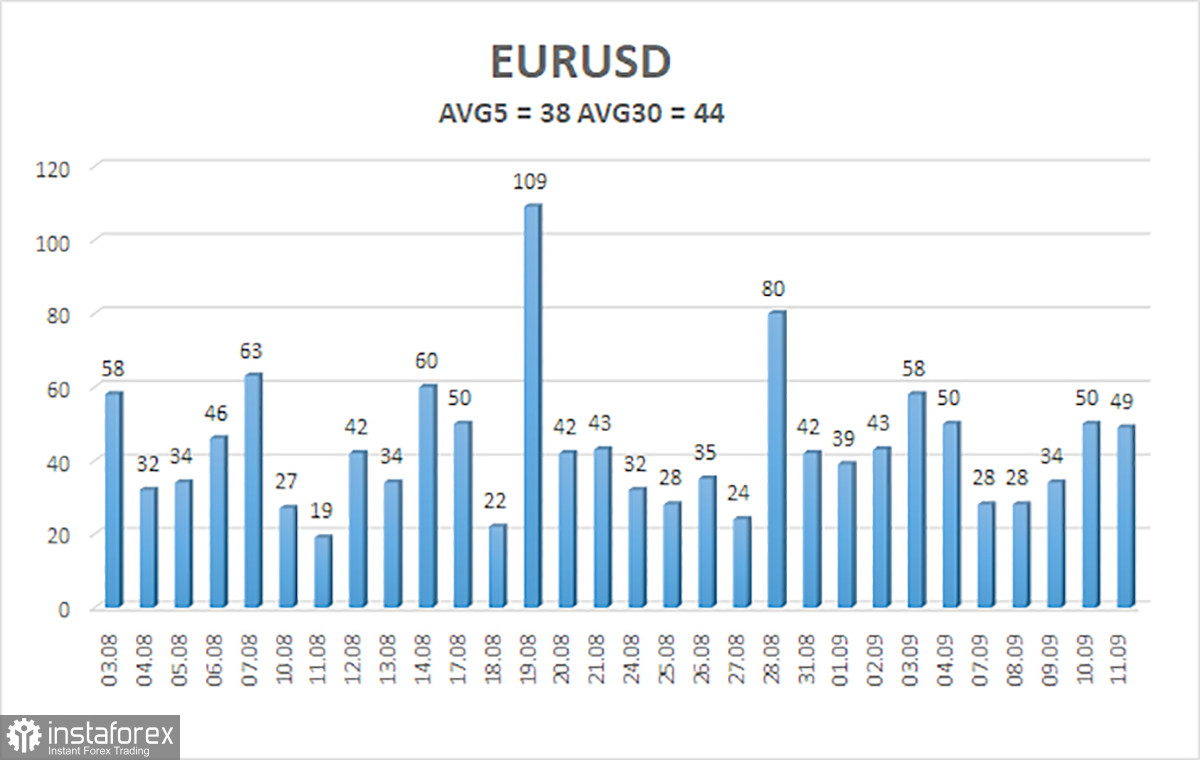
The average volatility of the EUR/USD pair over the last 5 trading days as of September 14 is 38 pips and is characterized as "low." We expect the pair to move between 1.1561 and 1.1637 on Monday. The higher linear regression channel points up, indicating an uptrend. The CCI entered the oversold area, warning of a possible end to the downward correction.
S1 – 1.1597
S2 – 1.1536
S3 – 1.1475
R1 – 1.1658
R2 – 1.1719
R3 – 1.1780
The EUR/USD pair continues an uptrend on the 4-hour timeframe, which may be the start of a new leg of a global uptrend on higher timeframes. The global fundamental backdrop for the dollar remains negative, but in 2026, geopolitics first and then the Fed's hawkish stance provided strong support for the US currency. However, those factors no longer support the dollar at present. If the price is below the moving average, shorts can be considered on corrective grounds, with targets at 1.1561 and 1.1536. Above the moving average line, long positions remain relevant with targets at 1.1658 and 1.1719.
Regression channels help determine the current trend. If both are directed in the same direction, it means the trend is currently strong;
The moving average line (settings 20,0, smoothed) defines the short-term trend and the direction in which trading should be conducted at present;
Murray levels are target levels for moves and corrections;
Volatility levels (red lines) are the probable price channel within which the pair will spend the next 24 hours based on current volatility indicators;
The CCI indicator – its entry into the oversold area (below -250) or the overbought area (above +250) indicates that a trend reversal in the opposite direction is approaching.


