
Shuningdek qarang


 10.09.2026 07:22 AM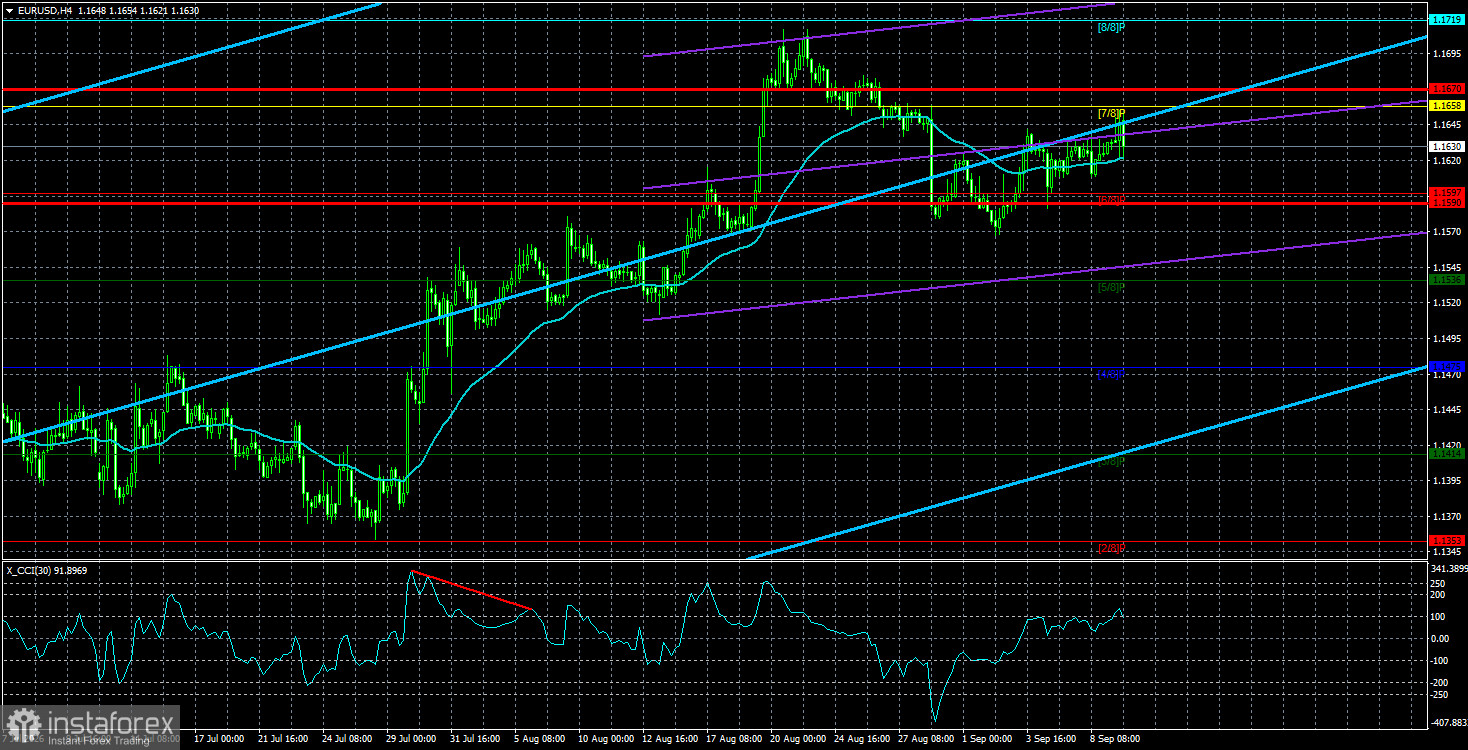
Iran and the US continue to trade occasional strikes. This week it became known that Washington destroyed five Iranian tankers, and Tehran retaliated with attacks on US military bases in Jordan — another episode of escalation that the market increasingly treats as background noise: an "escalation with a yawn." Neither side appears ready to back down from its demands, so disputed incidents near the Strait of Hormuz periodically occur and require military responses. The market has long stopped reacting strongly to these events; many traders and analysts still ask why.
The answer is simple, and we have repeated it many times this summer. Geopolitical risk is a perishable factor with a limited shelf life. If a war between Iran and the US lasted five years, would demand for the dollar as a safe haven keep rising for all five years? Conflicts happen often around the world, and you cannot assume any new conflict will perpetually drive demand for the dollar. The dollar strengthens on geopolitics not because a war starts, but because investors feel safer holding dollars — capital flees conflict zones. Because flight is best achieved abroad, investors need an international currency that is widely accepted and stable. Only a few currencies fit that description, and the dollar is clearly first among them.
The initial capital flight typically happens quickly. Thus the pure geopolitical premium usually lasts only about 2–3 months. If a war expands geographically, drags in new states, or destroys infrastructure, geopolitics can resurrect as a sustained market factor. But in recent months Iran and the US have exchanged occasional "slaps" rather than escalating to full war. Neither side seems eager for full-scale conflict. They protect their interests in the region and respond to provocations — and the market has grown used to that pattern. If capital already left the Middle East months ago, why would demand for dollars rise further?
At the same time, oil prices keep rising because traders increasingly fear a worsening energy outlook. The longer the conflict continues, the lower the chances of Hormuz reopening and the greater the risk of disruptions elsewhere (including Bab al-Mandeb). Global buyers front-run winter needs, increasing purchases of oil, gas and fuel; rising demand against constrained supply pushes prices higher. Therefore, the dollar may ignore a new escalation while the oil market reacts strongly.
The EUR/USD pair continues an uptrend on the 4-hour timeframe, which may mark the start of a new leg in a global uptrend on higher timeframes. The global fundamental backdrop for the dollar remains negative, although in 2026 geopolitics first and then the Federal Reserve's hawkish stance provided strong support for the US currency. However, at present those factors no longer support the dollar. If the price is below the moving average, consider shorts on corrective grounds with targets at 1.1581 and 1.1536. Above the moving average, long positions remain relevant with targets at 1.1665 and 1.1719.
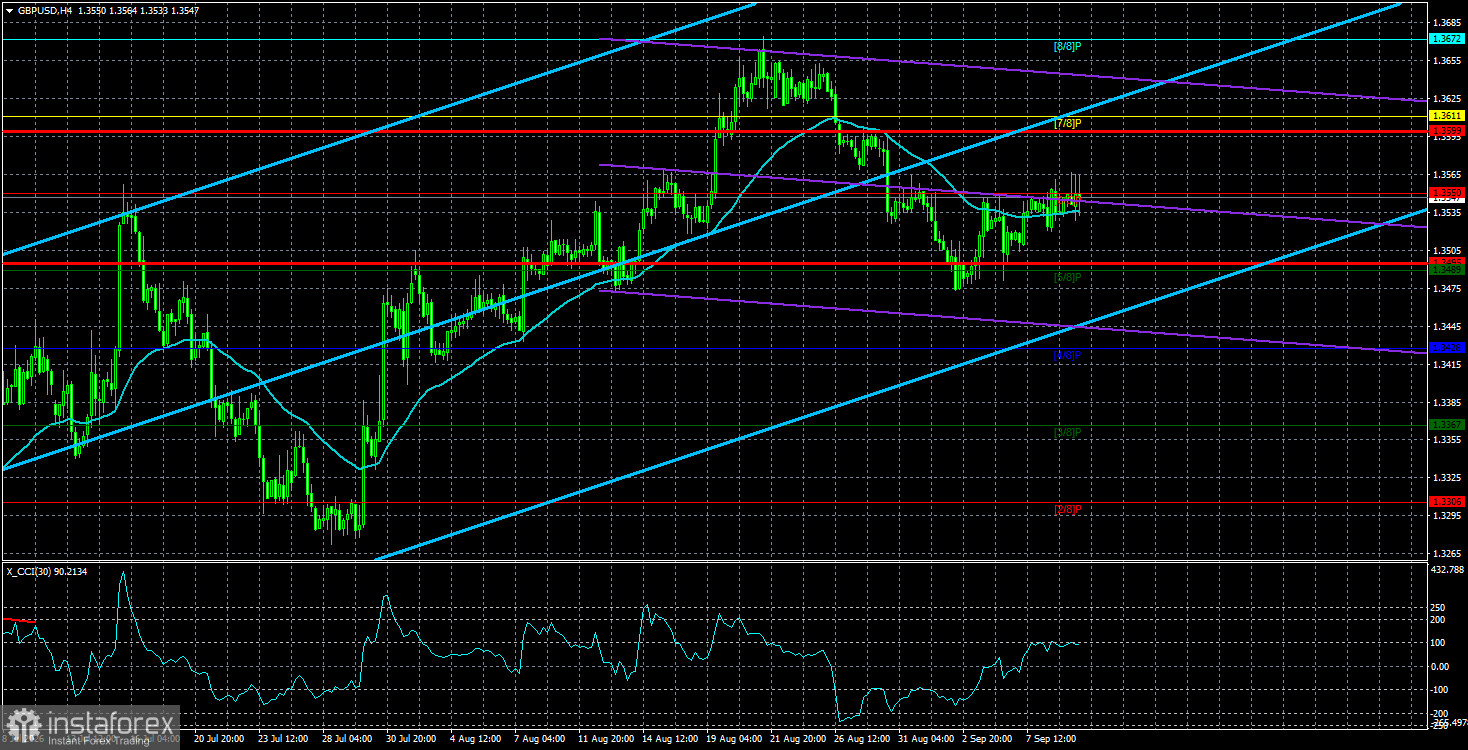
The GBP/USD pair retains an upward trend. Donald Trump's policies will continue to put pressure on the US economy, so we do not expect long-term dollar strength. 2026 has been positive for the dollar so far due to geopolitics, but every story ends. On the weekly timeframe, the pair remains flat between 1.3150 and 1.3780 within a four-year uptrend, supporting expectations of continued pound appreciation in the medium term. Long positions with targets at 1.3585 and 1.3611 can be considered when price is above the moving average. If price is below the moving average, consider short positions with targets at 1.3489 and 1.3479.
Linear regression channels help determine the current trend. If both are directed in the same direction, it means the trend is currently strong;
The moving average line (settings 20,0, smoothed) defines the short-term trend and the direction in which trading should be conducted at present;
Murray levels are target levels for moves and corrections;
Volatility levels (red lines) are the probable price channel within which the pair will spend the next 24 hours based on current volatility indicators;
The CCI indicator – its entry into the oversold area (below -250) or the overbought area (above +250) indicates that a trend reversal in the opposite direction is approaching.

